Configure New Relic and activate alerts
New Relic is an observability platform that allows you to monitor your applications’ performance.
In this guide, you will learn how to configure New Relic Free and activate alerts independently for two key metrics: Response Time and Error Rate. Each use case is configured separately, so you can manage specific alerts according to the metric you want to monitor.
Application Instrumentation

These initial steps are required to get New Relic running on your application:
-
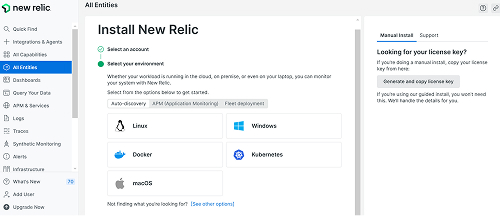
Create your free account
- Visit https://newrelic.com/ and click on “Get Started Free”.
- Select the Free plan and complete the registration process.
- Access your main dashboard at https://one.newrelic.com/
-
Install the agent on your application
- Choose the programming language of your application (for example, Node.js).
- Follow the instructions in the official New Relic documentation: https://docs.newrelic.com/docs/agents/nodejs-agent/getting-started/introduction-new-relic-nodejs (depending on your application’s stack)
Example for a Node.js application:
npm install newrelic --save -
Add your license
- Locate the configuration file generated by the agent (for example, newrelic.js in Node.js).
- Copy your License Key from your dashboard at https://one.newrelic.com/.
- Paste the License Key in the designated section of the configuration file.
-
Run your application
- Ensure that the configuration file is loaded at the start of your application.
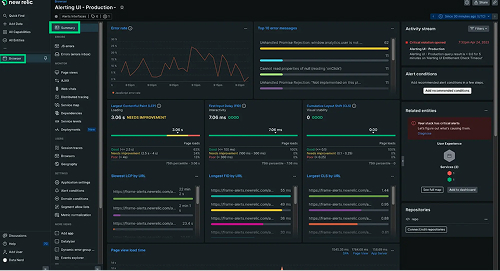
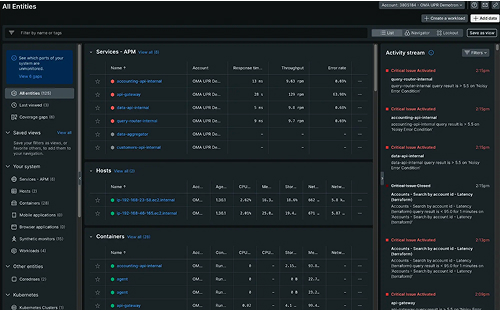
- Run your application and verify on the New Relic dashboard (https://one.newrelic.com/) that data is being received.
Use Case 1: alerts for Response time

-
Configure the alert policy for Response Time
- Access the section “Alerts & AI” in your dashboard
- Create a new Alert Policy and name it, for example, "Alert - Response Time."
- Within this policy, create a condition:
- Select the Response Time metric of your application.
- Set a threshold, for example: "If the response time exceeds 500 ms for 5 consecutive minutes"
-
Configure notifications for Response Time, via email (optional)
- Within the "Alert - Response Time" policy, add a notification channel.
- Select Email.
- Enter the email address where you want to send the alerts.
- Save the configuration and link this channel to the created condition.
-
Configure notifications for Response Time via Slack (optional)
- Add another notification channel and select Slack.
- Generate a Slack Webhook:
- Log in to your Slack workspace and go to “Manage Apps.”
- Search for and enable "Incoming Webhooks."
- Create a new Webhook for the desired channel (for example, #alertas-app) and copy the Webhook URL.
- Return to New Relic, paste the Webhook URL into the Slack channel configuration.
- Specify the name or identifier of the channel as required by Slack.
- Save the configuration and associate this channel with the Response Time condition.
Use Case 2: alerts for Error rate

-
Configure the alert policy for Error Rate
- In the “Alerts & AI” section of your dashboard, create a new alert policy and name it, for example, "Alert - Error Rate."
- Within this policy, create a condition:
- Select the Error Rate metric.
- Set a threshold, for example: "If the error rate exceeds 5% for 5 consecutive minutes"
-
Configure notifications for Error Rate, via email (optional)
- Within the "Alert - Error Rate" policy, add a notification channel.
- Select Email.
- Enter the email address where you want to receive the alert.
- Save the configuration and link this channel to the Error Rate condition.
-
Configure notifications for Response Time via Slack (optional)
- Add another notification channel and select Slack.
- Generate a Slack Webhook:
- Go to “Manage Apps” in your Slack workspace.
- Enable "Incoming Webhooks" if they are not already enabled.
- Create a new Webhook for the desired channel (for example, #alertas-app) and copy the Webhook URL.
- Return to New Relic, paste the Webhook URL into the Slack channel configuration.
- Specify the name or identifier of the channel as required by Slack.
- Save the configuration and associate this channel with the Error Rate condition.
This way, you will be able to monitor and respond specifically to incidents in each metric, optimizing the performance and reliability of your application.
To know more visit the official page of New Relic: