Patrones de observabilidad para aplicaciones modernas

Pedro J. Molina, PhD.
Metadev Whitepaper: Observability Patterns for Modern Applications.
© Metadev, Seville, Spain, EU. MMXXII.
All rights reserved.
Cover design & image: Paco Soria, 2022.
Produced with LATEX / MiKTEX and pdfTEX.
About
Metadev S.L. is a company devoted to creating high quality software on the cloud. Metadev
helps its customers to improve processes, train technical staff, and recommend practices
for excellence in development and operation optimizing ROI on Software investments.
Metadev | info@metadev.pro

Pedro J. Molina, PhD
Metadev’s Founder
Executive Summary
This document presents key technical patterns to expose application’s health, metrics, logs and KPIs in a standardized way to allow aggregate reporting and quick decision making by stakeholders.
Contents
-
1.Goal
-
2.Patterns & practices
- 2.1 Visible Version
- 2.2 Ping/Heartbeat Endpoint
- 2.3 Metrics Endpoint
- 2.4 Status Page
- 2.5 Health Endpoint
- 2.6 Structured Log
- 2.7 Centralized Log
- 2.8 Application Instrumentation
- 2.9 Configuration Management
- 2.10 Central Configuration Management
- 2.11 Audited Configuration Management
1. Goal
This whitepaper provides a set of condensed best practices distilled at Metadev when dealing with Application Monitoring and operation in production with the goal of saving time and effort and reduce overall downtime. We help customers to implement these practices to deploy and operate application on scale with safety and security. Expected audience: CTOs & Software Architects.
2. Patterns & practices
- Visible Version
- Ping / Heartbeat Endpoint
- Metrics Endpoint
- Status Page
- Health Endpoint
- Structured Log
- Centralized Log
- Application Instrumentation
- Configuration Management
- Central Configuration Management
- Audited Configuration Management
2.1 Visible Version
Application’s users should be able to know the exact version of the product they are using.
 Showing in a prominent place of the UI (f.e. footer, welcome or about page) the version number. This
information will be useful for:
Showing in a prominent place of the UI (f.e. footer, welcome or about page) the version number. This
information will be useful for:
- Verify a deployment matches the expected version.
- Discover/ensure versions on environments.
- Report bugs with the corresponding exact version where they were found.

2.2 Ping/Heartbeat Endpoint

Applicable in Web applications, services and long running
processes. It provides a specific endpoint f.e. GET /ping
in a way a client can verify if a service instance is available
or not responding.
For a call as follows:
curl https ://server/ping
The service will respond with:
200 OK
Content-Type: application/json

{ " message ": " pong " }
In case of failure, the client will receive a timeout or a network error. Ping service does not need
securitization (no credentials needed). However, can be constrained to respond to specific internal
IPs if confronted with Denial-of-Service attacks.
In services needing been monitored to verify availability and correct operation (almost all of them).
Scalable services behind a load balancer, in containers or Kubernetes. This ping or heartbeat service
allows a load balancer like nginx [9] or ha-proxy [2] to route workload to different nodes dynamically
depending on latency observed in each node. Tools like Consul [6] or Nagios [14] allows to periodically
monitor service instances.
2.3 Metrics Endpoint
A dedicated metric endpoint allows to know about the performance indicators of the service. A
third-party system can query services to collect and centralize technical and business metrics. This information can be stored, aggregated and visualized in real time, also used as a alert triggers. Tooling like Prometheus [3], InfluxDB [12], or Graphana [13] allows to aggregate monitoring information, define
business dashboards and trigger alerts as needed.
In a call similar to this one (note the service provides API-Key authentication):
curl https://server:443/metrics -H "apikey = ab39z3d893"
The service will respond (example using Prometheus Metrics format):
200 OK
Content-Type: text/plain ; charset=utf-8

customers_enrolled 238
completed_courses 345
api_calls_counter{code="200"} 23456
api_calls_counter{code="404"} 132
load_average_1min_gauge 6.037109375
load_average_5min_gauge 8.2421875
load_average_15min_gauge 8.8232421875
memory_used_bytes_gauge 62867410944
memory_free_bytes_gauge 1557377024
In the sample you can see:
- Operative metrics as memory, CPU or I/O usage.
- Business metrics including customers enrollment and completed courses (to be defined as KPIs in each service).
Business services needing monitorization to verify availability and correct function. As default, all
services would need to be monitored in production.
“What cannot be measured, cannot be optimized.” — Lord Kelvin.
2.4 Status Page
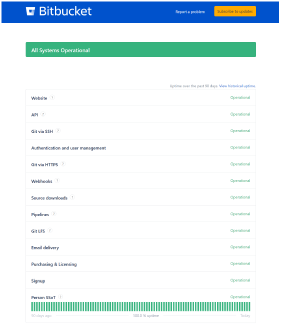 A Status page allows operators and developers to
verify a service has everything needed to operate in
a healthy state.
A Status page allows operators and developers to
verify a service has everything needed to operate in
a healthy state.
In particular, the focus is on checking the external dependencies of the service. Consider as external dependency every resource out of control of the application like:
- Environment configuration
- Databases availability and permissions
- File system availability, permissions, and free space
- Queues
- Send Mail service availability
- Third-party services
The Status page will perform a series of health checks to verify:
-
Environment configuration
- Correct settings and complete
- All compulsory parameters are passed
- All parameter passed are in the correct format (are valid)
-
Databases
- Connection string is valid
- Can connect to database
- Schema version match the expected one
- Has permissions on DB to read/write as needed
-
File System
- File System is accessible. Units are mounted (no timeouts).
- Read/write permissions are correct
- File system schema version is expected: folder and files structure conform the expected one
-
Queues
- Queue exists
- Permissions are correct
-
Send mail & third-party services
- Is possible to connect to the external service (ping or probe)
- Latency and connection times are under an acceptable threshold.
- Service Works (a query to service3/status is possible if implemented).
Samples:https://status.bitbucket.org, health-check of a home router.
Business Services needing to be monitored for proper behavior (all services in production).
Critical in complex services with many dependencies. Many dependencies and distributed systems, increases the chance of failure.
The Status page reduces a lot the time for diagnostic a failure caused by an external dependency. Saves developer’s time chasing for ghosts when the root cause for the failure is external. Direct ROI in terms of time and money saved in operation.
2.5 Health Endpoint
Quite similar to Status Page pattern, but oriented to machines rather than humans. It will return JSON or XML and will be systematically monitored and collected on a fixed frequency.
Sample call:
curl https://server:443/health
Sample response:
200 OK
Content-Type : application/json

{
  status : " Degraded ",
  dependencies : [
    { name : "BD", status : "OK" },
    { name : " Queues ", status : "OK" },
    { name : " Email ", status : " FAIL ", message : "No response "},
    { name : " GoogleMaps ", status : " DEGRADED ", message : " Latency greater
    than 500 ms" }
  ]
}
When the number of services to track and monitor grows, it’s a good idea to centralize and automate
health-check collection in a standardized way. Dashboards and alert systems can be setup feed by
the data collected. It allows to respond quick and proactively to infrastructure failures or third-party
services (in some cases before users are affected).
Allows to verify and track SLAs and effective availability of third-party services.
2.6 Structured Log
Standard log format shared across all applications in the company. It allows to implement common
trace and correlation ids in the aggregated log.
Select and apply a format for structured log. Samples:
- Structured Login
- Serilog
- Stackify
When orchestrating several services collaborating to resolve a single user request or when the number of services grows.
2.7 Centralized Log
Centralizes traces and service logs to be aggregated in a central service. Allows to explore traces
and filter logs using standard log exploitation tooling. Traces (with correlation-id) and structured logs
allows to track individual requests crossing several services.
Aggregate logs [1] using services like Elastic-Search [4] or Splunk [11].
Having a central log when the number of machines and nodes is greater than 5-8 is a key tool to
escalate production troubleshooting issues.
2.8 Application Instrumentation
Application Performance Monitoring tools (APM) instrument service code to measure via sampling
times and bottlenecks on CPU, memory usage, disk, IO, and time waiting for externals calls.
Using product like New Relic APM [10], Application Insight [5] or DataDog [8].
Recommendable in production systems. Allows to discover real bottlenecks (not in theory ones) and
to plan accordingly to this information the next optimization to tackle.
2.9 Configuration Management
Configuration Management is a disciple to control the configuration been passed to services in
environments. When the number of services (S), versions deployed (V ) and environments (E)
grows, the complexity (C) of handling the correct configuration increases as (C = S × V × E).
- Keep configuration in code, versioned in source control. Separated by environment and version.
- Track changes to configuration. Use a repository for all Configuration Management (different and independent from the service’s code).
- Verify configuration is correct using automation and/or service health-checks.
When the number of services is greater than 5-7.
2.10 Central Configuration Management
As the number of services (or microservices) keeps growing, many of them have similar configuration. Therefore, makes sense to centralize a source of configuration. Products like Consul [6] provides a high-availability key/value store where service configuration can be persisted and served.
The inversion of control applied here configures in each service a well-known DNS name and a port to reach the central configuration service. This service will provide the required configuration based on the service requesting, version and current environment.
Use a product for Central Configuration Management like Consul [6]. Setup it in high-availability mode
as configuration is a critical data for services to start-up.
When the number of services is greater than 12.
2.11 Audited Configuration Management
In scenarios where security is a key concern like Banks, Public Administration, aerospace, or military systems changes to Configuration Management must be tracked, reviewed, authorized and audited.
Changes to Configuration Managements can be done only by authorized principals and follow a review process workflow before application.
Implement such Audit and Workflow capabilities if security requirements are meet.
- Secure the Configuration Management tool. Integrate it with a workflow process.
- A git repository with signatures could be a great option. Can use PR as review process.
- Consider Vault [7] or similar product for credential storage and secrets.
Consider it when strong security requirements apply.
References
- [1] Stringfellow A. Log aggregation. https://stackify.com/log-aggregation-101.
- [2] HAProxy authors. Haproxy. http://www.haproxy.org.
- [3] Prometheus Authors. Prometheus. https://prometheus.io.
- [4] Elastic Search B.V. Elastic search. https://www.elastic.co.
- [5] Microsoft Corp. Application insights. https://docs.microsoft.com/en-us/azure/ azure-monitor/app/app-insights-overview.
- [6] Hashi Corporation. Consul. https://www.consul.io.
- [7] Hashi Corporation. Vault. https://www.vaultproject.io .
- [8] Datadog. Datadog. https://www.datadoghq.com.
- [9] F5 Inc. Nginx. https://www.nginx.com.
- [10] New Relic Inc. New relic apm. https://newrelic.com.
- [11] Splunk Inc. Splunk. https://splunk.com.
- [12] InfluxData. Influxbd. ww.influxdata.com.
- [13] Graphana Labs. Graphana. https://grafana.com.
- [14] Nagios Enterprises LLC. Nagios. https://www.nagios.com.
If you liked this whitepaper:
 Enroll into our newsletter for
future whitepapers &
techonology insight.
Enroll into our newsletter for
future whitepapers &
techonology insight.
 Feel free to forward this
whitepaper to anyone
interested in the topics covered.
Feel free to forward this
whitepaper to anyone
interested in the topics covered.
 Join the conversation & write
us at info@metadev.pro.
Join the conversation & write
us at info@metadev.pro.